Industry — Nonprofits
Financial clarity for mission-driven organizations.
Nonprofits need clean books, board-ready reporting, and dashboards that connect funding, programs, and impact. TIVAS brings 15 years of nonprofit bookkeeping experience to that work.
- Board Reports
- Grant Tracking
- Program Budgets
- Cash Flow
- Mission KPIs
What it looks like
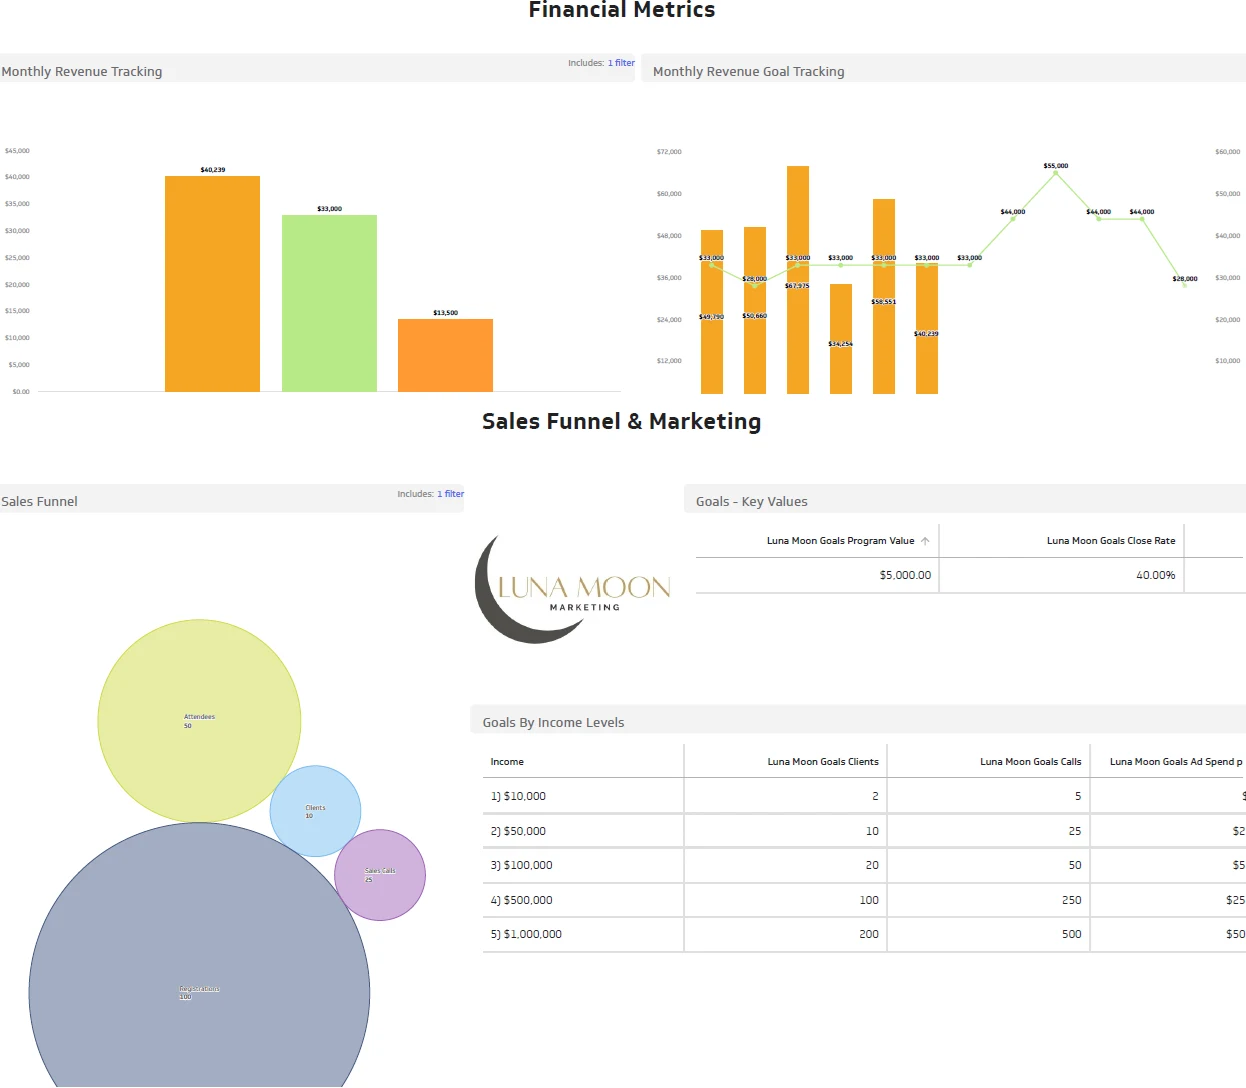
A nonprofit dashboard built around board decisions.
Program budgets, grant spend, cash position, and board financial summaries — organized in one clear view.
Where nonprofits get stuck
Four bottlenecks dashboards solve.
-
Board reports take too long to prepare
What's happening
Financial updates are rebuilt manually before each meeting, which slows decisions and creates room for inconsistencies.
How dashboards help
Dashboards create a repeatable board reporting view with the numbers leaders need every month.
-
Grant and restricted funds are hard to see
What's happening
Program budgets, grant spend, and restricted cash live in separate spreadsheets or reports.
How dashboards help
Grant dashboards connect budgets, spend, remaining funds, and deadlines so leadership can act earlier.
-
Programs are measured separately from finances
What's happening
Impact metrics and financial reports tell different stories, making it hard to see which programs need support.
How dashboards help
Mission dashboards pair financial KPIs with program indicators for clearer planning conversations.
-
Cash flow feels uncertain
What's happening
Donation timing, reimbursement cycles, payroll, and grant restrictions can make available cash hard to forecast.
How dashboards help
Cash dashboards surface timing, obligations, and available reserves before they become urgent.
Nonprofit KPIs
The metrics nonprofit leaders and boards use:
- Board financial summary
- Grant budget vs actual
- Program revenue and expense trends
- Cash flow and reserve visibility
- Donor / funding activity
- Mission impact indicators