KPI Dashboards
Turn your financial data into growth decisions.
Most business owners are overwhelmed by reports — but still lack clarity. We change that.
What You'll Experience
Instead of digging through spreadsheets…
- Visual dashboards with real-time business insights
- Clear KPIs tailored to your industry
- One place to see how your business is performing
Key Metrics We Track
Depending on your business, dashboards may include:
- Revenue trends & growth rate
- Profit margins
- Cash flow visibility
- Accounts receivable (DSO)
- Job or project profitability
- Marketing ROI

The Result
You and your team can:
- Make faster, smarter decisions
- Identify problems early
- Improve profitability
- Plan for growth with confidence
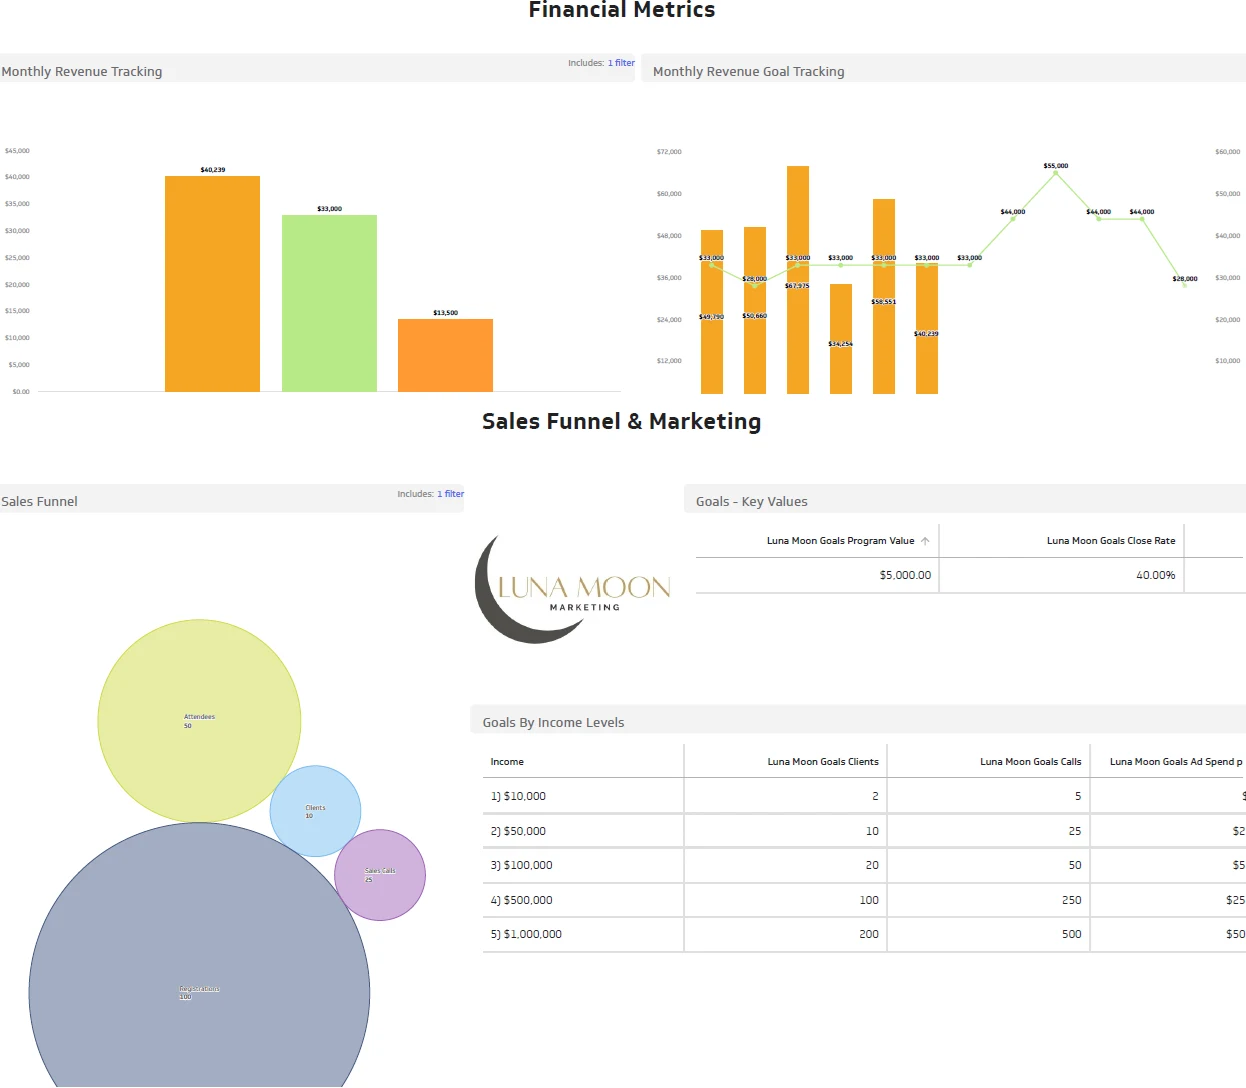
A Look Inside
Executive dashboards, built for action.
Not a Power BI template dump. Not a pretty chart no one opens. Dashboards designed around the decisions you need to make — monthly, weekly, and in the moment.
Your Tools, Unified
We connect what you already use.
-
 QuickBooks
-
 Microsoft Excel
-
 Google Sheets
-
 HubSpot
-
 Google Analytics
-
 Tableau
-
 Monday.com